Help Contents
Overview
Quick Start Guide
Portfolio Lists
Portfolios
Attributes
Prioritization
Optimization
Bubble Charts
Bar Charts
Ranking Charts
Efficient Frontier Charts
Sensitivity Charts
Ranking Chart Display Form
Form Overview
This form displays a single Ranking chart. In the chart area, the chart name is displayed at the top, the Y-axis name is on the left, and the (optional) bubble size label and uncertainty bar label at the top.
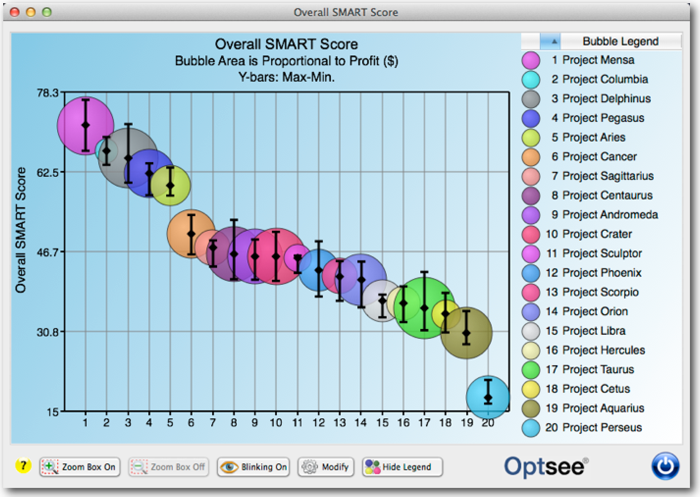
The Legend area, on the right side of this window, displays the item name next to a small representation of that item's bubble. You can display the legend in different ways using the Ranking Chart Preferences form.
You can open and modify an item by double-clicking on a bubble in the chart area or on a bubble or name in the Legend area. This will cause the corresponding Item form to be displayed.
Legends can be sorted by clicking on the headers at the top of the legend area. The number in the legend corresponds to the ranking numbers along the X-axis.
Ranking Charts can also display bubbles with areas corresponding to zero and negative values. Bubbles areas that correspond to negative values are displayed with the size representative of the negative value, but are white with an "X" spanning the diameter of the bubble. The "X" displays the color and pattern assigned to the item.
Bubble areas that represent to 0 are simply represented by X's. The "X" displays the color and pattern assigned to the item.
Changes to the chart display are made using the Ranking Chart Preferences form, which is opened by clicking on the [Modify] button at the bottom of the bubble chart legend area or selecting the File->Preferences menu item.
One option found in Preferences is to display the names of the projects along the X-Axis. This is useful if you want to view a larger chart by hiding the legend.

You can set the initial size of the bubble chart window using the Set Ranking Chart Size form and you can adjust the chart size by dragging the lower right corner.
Each time a Ranking Chart is opened, the Drawing Tools Toolbar is opened with the chart (if it isn't already displayed).
You can also print and export the chart displayed in this form using the standard "Print" and "Export" menu items under the "File" menu.
The Ranking Chart Display Form Buttons:

[Zoom Box On] button: Click this button to enable drawing a "zoom box." A zoom box lets you zoom-in on an area of a bubble chart by displaying the only bubbles defined by the area of the zoom box. After clicking [Draw Zoom Box], you define the area that you want to isolate by dragging the mouse. When you release the mouse, the bubble chart is redrawn to only display the area defined by the zoom box. See Using Zoom-Boxes for more information.
[Zoom Box Off] button: Click this buttons to restore the chart to its original display parameters.
[Blinking On/Off] button: Click this buttons to start/stop the blinking of any projects that have been set to blink in the Project form.
[Modify]: Click this button to display the Ranking Chart Preferences form.
[Show/Hide Legend] button: Use this button to toggle the display of the legend on and off in the form.
[Close]: Click on this button to close the Ranking Chart form.