Help Contents
Overview
Quick Start Guide
Portfolio Lists
Portfolios
Attributes
Prioritization
Optimization
Bubble Charts
Bar Charts
Ranking Charts
Efficient Frontier Charts
Sensitivity Charts
The Portfolio Baseline Change Indicator Limit Form
Form Overview
This form allows you to set the change indicator limits for a portfolio. The change indicators are visual indicators that a portfolio value has changed outside of a user-specified limits compared to the baseline. This allows you to quickly determine how the SMART Score has changed and which attributes have changed by glancing at a Portfolio Trend Tracker form.

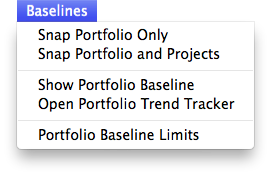
You use the Portfolio Baseline Change Indicator Limit form to view and modify the change indicator limits for each portfolio. You can open this form by selecting the "Portfolio Baseline Limits..." menu item from the Portfolio "Baseline" menu (Figure 1).
Figure 1
The Change Indicator limit settings allow you to set two ranges of values for both the SMART Score and attributes that will trigger an change indicator being displayed in the Portfolio Trend Tracker form. One limit triggers when there is a minor deviation from the baseline (e.g. exceeding ±5%), and the next one triggers when there is a major deviation from the baseline (e.g. exceeding ±10%).
When a change exceeds a minor or major change limit, the Portfolio Trend Tracker form field an arrow next to the baseline or attribute indicating the type of change (major or minor) by the color and the direction of the change (positive or negative) by the direction. (Figure 2)
Figure 2

Portfolio Baseline Change Indicator Radio Buttons:
For Simulation-Prioritization portfolios, you can choose which SMART Score Tracking Indicator value that you want to use to trigger a change limit alert: "Sum Total," "Sum of Means," or "Sum of Medians." Otherwise, the change alerts are tiggered by "Sum Total".

[Use SMART Score Sum Total] radio button: Triggers the SMART Score change indicator based on the sum of all the project SMART Scores.
[Use SMART Score Sum of Means] radio button: Triggers the SMART Score change indicator based on the sum of the mean SMART scores from the simulation. For example, if a simulation-prioritization was performed using 1000 simulated portfolios, the "Sum of the Means" would be the mean of the SMART Score sums from each portfolio.
[Use SMART Score Sum of Medians] radio button: Triggers the SMART Score change indicator based on the sum of the median SMART scores from the simulation. For example, if a simulation-prioritization was performed using 1000 simulated portfolios, the "Sum of the Medians" would be the median of the SMART Score sums from each portfolio.
Baseline Change Indicator Limit Fields:
SMART Score Minor Change (%) Field: This field displays the limit range of the attribute percent change that would trigger a minor change indicator for the SMART Score. For example, if the minor limit is 5%, any changes from the last SMART Score baseline value greater than or less than 5% would would be indicated by a minor change indicator displayed in the portfolio form. (Figure 2)
SMART Score Major Change (%) Field: TThis field displays the limit range of the attribute percent change that would trigger a major change indicator. For example, if the major limit is 10%, any changes from the last SMART Score baseline value greater than or less than 10% would would be indicated by a major change indicator displayed in the portfolio form. (Figure 2)
Attribute Minor Sum Change (%) Field: This field displays the limit range of the attribute percent change that would trigger a minor change indicator. For example, if the minor limit is 5%, any changes from the last baseline sum value greater than or less than 5% would would be indicated by a minor change indicator displayed in the portfolio form. (Figure 2)
Attribute Major Sum Change (%) Field: TThis field displays the limit range of the attribute percent change that would trigger a major change indicator. For example, if the major limit is 10%, any changes from the last baseline sum value greater than or less than 10% would would be indicated by a major change indicator displayed in the portfolio form. (Figure 2)
Baseline Change Indicator Limit Buttons:
[Save As Default] check box: Click on this check box to save these limits for all new portfolios.
[Save]: Click on this button to save any changes made to the Baseline Change Indicator Limits.
[Close]: Click on this button to close the Baseline Change Indicator Limit form without saving any changes.