Help Contents
Overview
Quick Start Guide
Portfolio Lists
Portfolios
Attributes
Prioritization
Optimization
Bubble Charts
Bar Charts
Ranking Charts
Efficient Frontier Charts
Sensitivity Charts
Tracking Uncertainty and Risk in Optsee®
Tracking uncertainty allows you to assign plus/minus ranges to individual attribute values in projects. For example, you could assign a cost at $500 with a high cost of $525 and a low cost of $490. In Optsee, the high value is referred to as the “Plus” value, the low value is referred to as the “Minus” value, and the primary value is referred to as the “Likely” value.
Optsee automatically calculates the "Likely," "High," and "Low" SMART Prioritizer values based on the uncertainty ranges, and displays them in the Portfolio and Project forms.
As can be seen below, Uncertainty Tracking can be turned on and off for a Portfolio by using the check box in the Portfolio Preferences form.
1. Start by opening a Portfolio form and then open the Portfolio Preferences form.

Once Uncertainty Tracking has been activated, the “High” and “Low” value scores are calculated automatically, and the columns displaying these values can be toggled “on” and “off” using the [Hi-Lo] button in the portfolio toolbar.
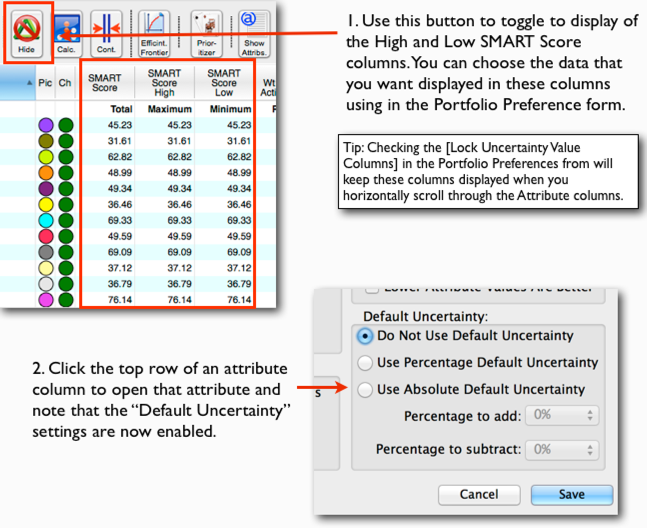
Default Uncertainty settings in the Portfolio Attribute form let you control how the uncertainty is set for each individual project attribute. You can set it manually in each project or have it calculated automatically for all the projects in the portfolio.

Project forms have two additional columns to display and edit the “Plus” and “Minus” values when Uncertainty Tracking is activated. In addition, there are two additional value-score fields that display the high and low values calculated using the SMART prioritizer.

You can view your uncertainty data in 2D bubble charts, attribute sensitivity charts, and ranking charts by selecting the [Show Uncertainty Bars] check-box in the respective chart preferences form. Uncertainty bars are not available for display in 3D bubble charts or weight sensitivity charts. Project Ranking charts are discussed in the next section.
