Help Contents
Overview
Quick Start Guide
Portfolio Lists
Portfolios
Attributes
Prioritization
Optimization
Bubble Charts
Bar Charts
Ranking Charts
Efficient Frontier Charts
Sensitivity Charts
Creating and Using a Ranking Chart
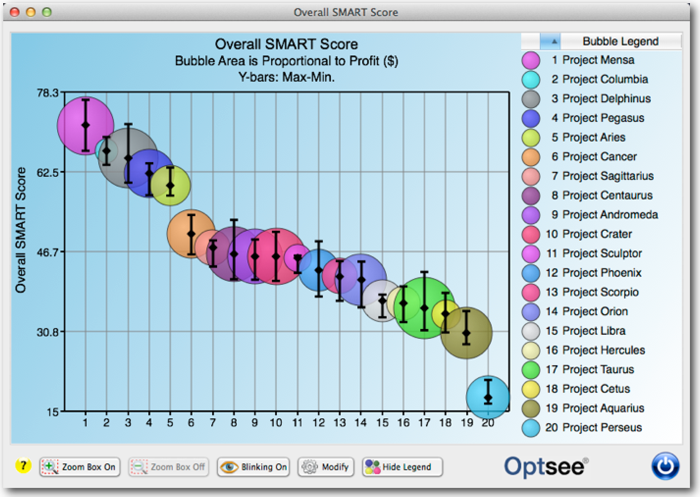
Ranking charts provide a unique and informative view of your projects ranking. Ranking charts can be used to rank projects by the SMART value scores or other attributes. In addition, you can add an additional level of data visualization by adding bubbles to the project ranking.


The projects in this Ranking Chart are ranked by value score from left to right. The projects on the left have the highest SMART value scores. Each bar represents the highest, lowest, and likeliest value score as calculated by the SMART prioritizer using the values entered for each project in the portfolio.

You can also display bubbles in this chart for an additional data dimension. Open the Ranking Chart Preferences form and select an attribute for the bubble size and then check the [Display Bubbles] check box.
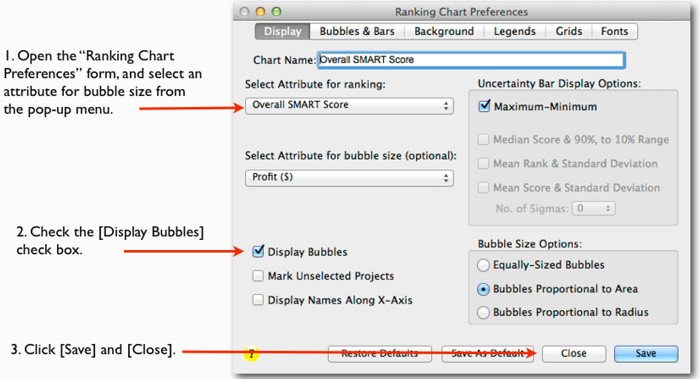
In addition to the project rankings by value scores, the chart now displays an additional set of data represented by bubble size.