Help Contents
Overview
Quick Start Guide
Portfolio Lists
Portfolios
Attributes
Prioritization
Optimization
Bubble Charts
Bar Charts
Ranking Charts
Efficient Frontier Charts
Sensitivity Charts
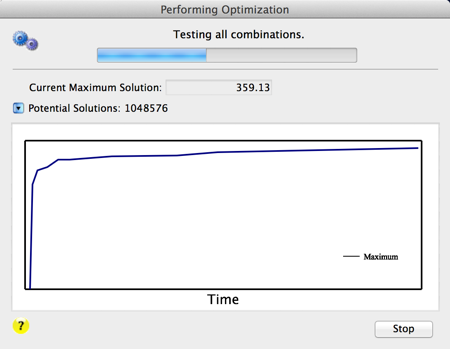
Optsee Optimizer™ Progress Tracking Form
This form displays the progress of the optimization. The blue line represents the changing optimization maximum.
In very fast optimizations (less than five seconds), the line on the form may not appear to move.
Progress form for Genetic optimization:

Progress form for Branch and Bound optimization:

Progress form for Brute Force optimization:
Once complete, the Optimize Portfolio Form is automatically closed and the Optimization Results Form is displayed. The optimized portfolio is displayed in the "Last" column of the Portfolio form (if it is open) or in the "Base" column (if it is the first optimization).